1. 4.

Tuesday, September 30, 2008

The LOS ANGELES KINGS SPR by Big Tex


ORIGINALLY POSTED AT
www.ongoalanalysis.com
30 September 2008

The Los Angeles Kings are six years removed from their last playoff appearance. Last season marked a new low, as they finished last in the Western Conference. In 08-09, there’s nowhere to go but up. How high will they climb in the standings this season?

In the last three seasons, the Kings have failed to qualify for postseason play, finishing an average of -9 below the Playoff Qualifying Curve, or PQC. That average is a bit misleading, however, as LA ended the 05-06 campaign at -2.5. The past two seasons have been brutal down on Figueroa.

Some statistics of note from last season:
  • First, the good news: The Kings were quite good at holding onto a lead going into the 3rd period, winning 91.7% of those games (5th in the NHL)
  • Now, the bad news: LA had the worst Penalty Kill in the NHL (78.0%)
  • Their Goals/Game average was a middle-of-the-pack 2.76 – remarkable, given the fact that the Kings had just FIVE players score 10+ goals
Los Angeles used SEVEN different goalies last season – three more than any other team
Following a season like 07-08, any team would be blown up and rebuilt by management, and the Kings are no exception. Head Coach Marc Crawford was replaced with veteran bench boss Terry Murray. Top defensemen Rob Blake and Lubomir Visnovsky were sent packing, as was 2nd line center Mike Cammalleri. Taking their places are center Jarret Stoll (acquired from Edmonton) and rookie d-men Drew Doughty and (possibly) Thomas Hickey. Make no mistake: youth rules in Hollywood, and youth will rule the Kings.

For better or worse, Los Angeles will have one of the youngest defensive units in the NHL this season. If the Kings can settle on one – or maybe two – goalies, though, the lack of experience on the blueline won’t hurt quite so much. Up front, LA has in Anze Kopitar and Dustin Brown two young stars on the rise (and if they could re-sign Patrick O’Sullivan, the Kings would have three). Los Angeles should show improvement over last season, but patience will be necessary – these kids need time to develop.


The Kings’ first ten games of the season are played 11 OCTOBER – 1 NOVEMBER. Our exhaustive research indicates that in that timeframe, LA earns an average PQC rating of 5.0 and about ten points in the NHL standings. Last season, the Kings played below the PQC from Game 1, and were called OUT of the playoffs by OGA on 10 DECEMBER. In the 05-06 campaign, LA fell into OGA’s “13% Club” – OGA calls are made with just over 87% accuracy – by getting off to a strong start and prompting us to call them IN the playoffs on 25 OCTOBER. OGA did not anticipate the Kings’ nosedive in the second half of the 05-06 season, but we have learned from the experience.

Some statistics of note for OCTOBER:
  • The Kings are a combined 14-14-2 through the first ten games since the Lockout
  • In 07-08, LA began their campaign with two games in London, and jet lag was a problem: they lost four straight upon their return to North America
  • Los Angeles won’t do much early-season traveling in 08-09: only 3 of their first 10 (and 9 of their first 31) games are on the road.
OGA will be measuring the Kings against their average PQC rating of 5.0, as well as against other NHL teams, in order to provide you more in-depth analysis with Los AngelesGame 10 Report, due to season subscribers by 2PM CST on 2 NOVEMBER, and available for order from ongoalanalysis.com by 2PM CST on 3 NOVEMBER. (See a sample G10R here…)

Realistically, the Los Angeles Kings are at least a season away from battling for a playoff spot. That does not mean, however, that they won’t be worth watching. If the Kings can find a goalie ready to claim the starting role, errors committed by their young D-men (D-boys?) won’t be so glaring, and the youngsters (or, in the cases of Jack Johnson and Drew Doughty, youngstars) will gain confidence. Blueliners who are willing and able to take calculated risks will provide Anze Kopitar, Dustin Brown & co. with greater opportunities to showcase their All-Star talents. All in all, the Kings should be quite entertaining, but expectations must be tempered by the fact that they play in the toughest division in the NHL. Follow the Kings’ progress in The OGA Blogs, and don’t miss the comprehensive review of the first ten games in the Los Angeles G10R on 3 NOVEMBER.

Wednesday, we’re off to Music City for the Nashville Predators SPR. Until then, Big Tex says, “Try the funnel cake, because you can only eat so many corny dogs before you need a little something sweet.”

TAKE ME BACK TO www.ongoalanalysis.com

1. 4.

The OTTAWA SENATORS SPR by The Colonel


ORIGINALLY POSTED AT
http://www.ongoalanalysis.com/
on 30 September 2008


The Senators join New Jersey and seven other organizations as the only teams to have progressed to the playoffs in each of the three seasons since the Lockout. In those seasons’ playoff series, the Senators are 4 – 3, to include coming up short against the 2006/7 Stanley Cup Champion Anaheim Ducks. Additionally, against the Playoff Qualifying Curve (the PQC), they have earned a nine out of a possible 10 for a single, 10-game period in each season. These winning streaks have been used alternately to propel them, or support sliding the Sens into a playoff berth.

In two of the past three seasons, OGA called Ottawa IN the playoffs by the end of Game 10. The third instance was ironically much later – 20 FEBRUARY (Game 60) in their Stanley Cup Finals appearance year. Strong starts in 2007/8 and 2005/6 propelled them into the playoffs. But in 2006/7 – their Stanley Cup Final appearance season – they started slow and battled through the season to the playoff position that sent them on in to the finals. It is difficult not to draw the conclusion that the Senators need some adversity to truly motivate them on to greatness.

What did we see last season and what is on the 2008/9 horizon?

The Senators ended the last three years with an average rating of +5.5 above the PQC. But Ottawa finished last year at only a +.5 signaling a negative performance problem and horrifying many of their fans in the process. Of note from the 2007/8 season the Senators:

  • Began the season one win shy of perfect. The Senators’ one loss was a two-goal defeat, the last of which coming from an Eric Staal shot into an empty net in the last minute of play.
  • Ottawa then began a slide with only three, 10-game periods in which they improved their play from the immediately previous 10-game tilt.
  • The Senators were one-for-one in ‘Bonus Hockey’ in both the Game 10 and Game 20 periods.
  • Followed up their performance in Games 1 – 10 with seven wins in Games 11 – 20.
We believe the Senators’ first 10 games against the PQC just may indicate how difficult their season may be as they chase a bid into the playoffs. If they play this year per their three year average, Ottawa will show indications that they are playing toward securing a playoff berth early on, but they will not solidly clench that spot with enough flair to make their followers watch contests comfortably. Senators fans will want to follow OGA’s early analysis to help manage their expectations on into Hockey’s ‘Second Season.’
The measure of the Senators’ performance against the PQC is demonstrated in the graph below. As you can see, Ottawa began the last two years stronger in the first 10 games than they performed in the following 10. The PQC also shows that their winning margin moves toward the curve from Game 21 to Game 40 by early JANUARY. After that point, Ottawa’s true performance character for the season is confirmed. Everyone knows key injuries and some undefined dressing room issues almost sunk the Senators’ chances of moving into the playoffs, but the ability to compete at the level necessary for lifting The Cup was just not there.
The Senators’ first 10 games of this season are played 4 – 30 OCTOBER. Unlike an example from the London Games last year, Ottawa has six days to return from Europe and readjust to their normal daytime/nighttime patterns before their next game. Our comprehensive analysis indicates that in that time frame, Ottawa earns an average PQC rating of 7.3, one of the highest Game 10 averages in the NHL. It would be even higher were it not for the slower start in the 2006/7 season. They have won two-of-three home openers and all three road openers over the last three seasons.

Some additional, critical statistics to keep in mind for the month of OCTOBER are:
  • From 3 – 30 OCTOBER, the Senators win 73.3% of games played.
  • The Senators win a combined average of 63.5% on Fridays and Saturdays.
  • On Sundays, Ottawa loses 61.5% of their contests.
  • And the Senators play an average of 1.67 ‘Bonus Hockey’ games in OCTOBER, producing an average winning percentage of 65.9%, especially in shootouts (72%). It is interesting to note no team has played LESS Bonus Hockey than Ottawa – they prefer to settle things up front.
During this stretch of play, OGA will carefully review team play and forward your Ottawa SenatorsGame 10 Report to season subscribers by 2pm CST on 31 OCTOBER and make it available for order from the On Goal Analysis web site by 2pm CST on 1 NOVEMBER. (See a sample G10R here…)

Will Coach Hartsburg’s new line combinations produce the increased offense in depth that the team is looking for? Will Ottawa begin the 2008/9 season strong or play just along the curve? How is team chemistry this year? Looking ahead into NOVEMBER, it is very important to note that if the Sens start slowly but display consistent play along the PQC, fans will not have as much to worry about than they might believe. OGA will be there with you to make the call.

More to follow. Until tomorrow and the St. Louis Blues Season Preview Report (SPR), this is The Colonel signing off…

TAKE ME BACK TO OGA
1. 4.

The PHOENIX COYOTES SPR by Frozen Pill


ORIGINALLY POSTED AT
www.ongoalanalysis.com
30 September 2008


The PHOENIX COYOTES are finally on the other side of the ‘rebuilding’ project. What was once a ghost town in the deserts of the West is now proving to be fertile prospecting grounds. For the prospects, that is.

Last season we saw the emergence of young rookies trusted with some major lifting for offensive production. Of the many comments made about coach Wayne Gretzky, we are certainly more familiar with the complete person after seeing his trust and patience given to the development of the young players in the PHOENIX system. Last year the investments began to return dividends.

In fact, OGA was not able to make the call on the PHOENIX COYOTES being IN or OUT of playoff contention until 11 MARCH 2008 (OUT). Whereas the previous season (06-07), we knew by the conclusion of their 10th game (24 OCTOBER 2007) the Desert Dogs were not OK in the corral.

The COYOTES already had their work ethic established under captain Shane Doan and the November 2007 waiver acquisition of Ilya Bryzgalov answered their questions in goal. But not having arrived quite yet, they struggled to dig themselves out of the point-challenged slow start they had to the 07-08 season.

During the course of the 2007/8 NHL Season:
  • The PHOENIX COYOTES rookies contributed more goals (63) than did entry-level players on any other team
  • The COYOTES finished 24th in the league on Penalty Kill percentage (80.72%)
  • PHOENIX played better on the road (21-17-3) than they did at home (17-20-4)
  • The COYOTES have not qualified for post-season play since 2002
Not having made the playoffs since 2002, the COYOTES have made the best of their draft picks (and draft placement) to secure a bevy of young players with serious NHL potential. In the 2007/08 NHL season we were introduced to Peter Mueller and the rookie’s 54-point contribution. We were obliged to meet (not in person, thankfully) Daniel Carcillo. Rookie Carcillo (324 penalty minutes) was to provide the team with a Sheriff. Well, in the West, the Sheriffs can shoot. With 13 goals and 11 assists opponents of the Desert Dogs were forced to play against his offensive skills as much as they tried to avoid his enforcer skills.

While the team is on an upwards trend overall, The COYOTES had a doggish start to the beginning of the last season as measured against the OGA-developed Playoff Qualifying Curve (PQC). At the end of the first 10-game segment, they were a -1.0 when measured against the Curve. They then managed to draw even with the PQC on two different occasions through the course of their campaign but never entered positive territory. We expect to see a stronger start this year but what should we expect per their performance as measured against the Curve?

(cont)…Now enters the highly anticipated 2007 draft pick (3rd overall), Kyle Turris. It also appears the 2008 Hobey Baker Award winner, Kevin Porter (22 years old) may also crack the lineup for the 2008/09 NHL season. Oh, and speaking of western expansion, PHOENIX is also the new home for and an out-of-towner who hasn’t missed a game in each of the last 4 seasons from Finland via Florida, Olli Jokinen. Welcome to the Saloon.

Last season, the PHOENIX COYOTES began their campaign as they had the previous two seasons and played at minimum a full point (-1) below the OGA-developed Playoff Qualifying Curve (PQC). Over the three years since the lockout, they have averaged -8.5 against the PQC. See the chart below for the COYOTES’ play in relation to the curve over the past three campaigns.


This season, the PHOENIX COYOTES first 10 games of the season are played 11 OCTOBER – 4 NOVEMBER. Our research indicates they earn a PQC rating of 3.2 during this time frame. This is a long stretch for 10 games and hopefully the COYOTES will not lose the momentum the start of a season naturally brings. The graph above shows this club has yet to find that early momentum at the start of a new campaign.

Some statistics of note to manage your expectations in to late October are:
  • The COYOTES play well below the PQC for the first ten games and then build momentum to be closer to or above the Curve
  • The team’s 3-year per game averages: 2.75 GF and 3.20 GA
  • The COYOTES have won 2 of its 3 season openers since the lockout
  • Post lockout, the COYOTES record in the first 10-game segments is 10-19-1.
  • Of the six home/away openers PHOENIX has won all 3 home season openers and lost all 3 away season openers.
  • PHOENIX has played a total of 43 games requiring either OT or a Shootout (17.48% of all regular season games). This is the second lowest average in the NHL over the previous three years so don’t expect much OT or shootout hockey with this club.
OGA will be measuring the COYOTES against their PQC Rating of 3.2 (as well as with all other NHL teams) in order to provide you more in-depth analysis with the PHOENIX COYOTES Game 10 Report. The G10R will be delivered to our subscription customers by 2PM Central on 5 NOVEMBER and available for purchase online by 2PM Central, 6 NOVEMBER. See the OGA store for more details HERE. You can also view a sample for our G10R HERE. (Make sure to view all 3 tabs!)

Last season found the COYOTES in good shape to finally form their identity. They lost less than 100 man games to injuries and another healthy season should propel them further up the mesa that is the Western Conference. They found the net-minder for their future in Ilya Bryzgalov who had a career year (26-22-5, 3 shutouts) and defenseman Ed Jovanovski (who only missed 2 games) played his career best with 51 points and also led the team in ice time (22.32). They have also improved over the previous 3 seasons in back-to-back games reversing a losing trend (4W-9L / 7W-9L / 9W-8L, respectively).

Will the COYOTES be able to capitalize early in this new season with some momentum from their young, creative playmakers? How will Olli Jokinen help the team in the first ten games of the season and beyond as measured against their PQC averages? Will OGA have to wait until March to know whether the improving PHOENIX COYOTES are IN or OUT of post-season play? OGA will be watching. And when we know, you will, too.

OGA will be measuring their team performance against the PQC online and via our Game Reports available for purchase. For your best value, see our subscription information HERE. In the meantime, stay tuned to The OGA Blog and check out the PHOENIX COYOTES G10R for a thorough review of the team’s performance as measured against our proprietary PQC.

Tomorrow brings the 07-08 Eastern Conference champions, the PITTSBURGH PENGUINS SPR. Remember, it’s only a puck until you take one in the teeth. Then, it’s a Frozen Pill.

TAKE ME BACK TO www.ongoalanalysis.com

1. 4.

Monday, September 29, 2008

The FLORIDA PANTHERS SPR by Big Tex


ORIGINALLY POSTED AT
www.ongoalanalysis.com
29 September 2008

The Florida Panthers haven’t played a game in the postseason since 2000. After finishing nine points out of a playoff spot in 07-08, the club made adjustments. Team Captain and leading scorer Olli Jokinen was traded for help on the blueline. A rookie head coach, Peter DeBoer, was hired. Will these changes bear fruit in 08-09?

The Panthers have been called OUT of the playoffs (per OGA) in early DECEMBER (05-06, 06-07) or JANUARY (07-08) in each of the last three seasons, finishing each season with an average of -3.83 against the Playoff Qualifying Curve, or PQC.

Statistics of note from last season:
  • Panthers games were full of shot: Florida ranked 4th in the NHL in Shots For/Game (31.1), and 29th in Shots Against/Game (33.6)
  • Florida struggled to hold leads, finishing with the league-worst win percentage when leading after two periods (.724)
  • A bright spot for the Cats was their power play, which was 6th in the league (19.17%)
  • Their 38 wins (38-35-9) represented the Panthers’ highest win total since 99-00, and 3rd most in franchise history
Florida’s Achilles heel last season was team defense. Were it not for the All-Star performance of Tomas Vokoun, who faced more shots than any other NHL goalie last season, the Panthers’ Goal Differential of -9 would’ve been much worse. Once they cleared their own zone, however, Florida’s group of speedy young forwards did a good job of putting the puck on the opposing net. The catch, of course, was getting the puck out of their own zone, which was the driving force behind many of the teams’ offseason moves.

While some might view the Olli Jokinen trade as a step back for the Panthers, OGA believes the upcoming season will prove the wisdom of the move. Not only did Florida receive two solid defensemen in return for their Captain, but they also sent a message to the remaining forwards: We believe in your ability to get the job done, and now is the time for you to step up. With a beefed-up blueline and a bunch of swift-skating kids up front, the Panthers will be a tougher team to play against in 08-09.


The Panthers’ first ten games are played 10 OCTOBER – 1 NOVEMBER. Our research indicates that in that timeframe, Florida earns an average PQC rating of 4.83 and about 10 points in the NHL standings. Last season, the Cats played consistently just below (within one point) of the PQC through the first 40 games. In games 41-50, the post-holiday hangover manifested itself once again. Florida dropped to -1.5 against the PQC during the month of January, which resulted in an OGA call of OUT of the playoffs on 22 JANUARY. After hitting that low point, the Panthers rebounded, trending generally upward along the PQC through the end of the season. Unfortunately, it was a classic “too little, too late” scenario, and Florida finished 11th in the Eastern Conference.

Some statistics of note for the first month of the season:
  • The Panthers have a combined post-Lockout record of 14-15-1 in their first ten games, but have trended downward, going 6-4, 4-5-1 and 4-6 from 05-06 to 07-08
  • They play two back-to-back sets in the first ten games, and historically win just 25.6% of second games
  • Four of Florida’s first ten games fall on Saturdays, and the Panthers have only won 34.4% of Saturday games over the last three seasons
OGA will be measuring the Panthers against their average PQC rating of 4.83, as well as against other NHL teams, in order to provide you more in-depth analysis with Florida’s Game 10 Report, due to season subscribers by 2PM CST on 2 NOVEMBER, and available for order from ongoalanalysis.com by 2PM CST on 3 NOVEMBER. (See a sample G10R here… )

The coming season brings with it a sense of cautious optimism where the Florida Panthers are concerned. Last season, they were competitive and posted a winning record, but fell well short of the playoffs. The Panthers’ summer moves are proof positive that management is committed to improvement, and OGA fully expects to see that reflected in the Cats’ play in relation to the PQC. Will Florida’s improvements keep pace with the rest of their suddenly very competitive division? Check out The OGA Blogs for updates, and the PanthersG10R for a comprehensive progress report. Who knows what playoff potential lurks in the hearts of (Florida’s) men? OGA knows…and you can, too.

From Atlantic to Pacific: Tune in Tuesday for the Los Angeles Kings SPR. Until then, Big Tex says, “Try the corny dogs.”

TAKE ME BACK TO www.ongoalanalysis.com
1. 4.

The NEW JERSEY Devils SPR by The Colonel


ORIGINALLY POSTED AT
on 29 September 2008

The Devils join Anaheim and seven other organizations as the only teams to have progressed to the playoffs in each of the three seasons since the Lockout. In those seasons’ playoff series, the Devils are 2 – 3, coming up short in the second round twice and falling to the New York Rangers in five games last season. They have been relatively easy to predict against the Playoff Qualifying Curve (the PQC), beginning the season with a rating just under The Curve at 4.7. They tend to surge, however, in Games 11 – 20 equal to or above the PQC, a feat the Devils repeat another three out of the six remaining 10-game periods.

In the past two seasons, OGA called New Jersey IN the playoffs by early JANUARY and late NOVEMBER respectively. In the 2005/6 season – the same one in which they swept the Rangers and then ran into the eventual Stanley Cup winning Carolina HurricanesOGA would have called them OUT of the playoffs by 3 JANUARY and then eaten crow in early APRIL when the Devils mathematically clinched with a late-season, 11 – 1 winning run.

What did we see last season and what is on the 2008/9 horizon?

The Devils ended the last three years with an average rating of +4.67 above the PQC. They finished last year a +3 against the PQC. Of note from the 2007/8 season the Devils:
  • Began the season slower than Devils fans are used to with only three wins and one OTL, likely influenced by nine straight road games while they awaited the opening of The Rock.
  • Followed up their performance in Games 1 – 10 with five wins and one OTL in Games 11 – 20. This is still slower than New Jersey fans would like, but the beginning of a positive trend for the rest of the season.
  • Were called IN the playoffs by OGA on 4 JANUARY, 20 games later than the year before
  • Were zero-for-one in ‘Bonus Hockey’ (a game progressing into Overtime or a Shootout), in both the Game 10 and Game 20 periods.

We view the Devils as a team whose play against the PQC requires scrutiny onward into the season in order to determine when they will clinch a playoff berth. Devils fans will want to follow OGA’s early analysis, however, to determine if their level of play is more like the last two seasons or the first, post-Lockout year.

Our measure of the Devils’ performance against the PQC is shown in the graph below. It is clear New Jersey finished all three seasons strong. The PQC, however, shows that their winning margin decreased from 2006/7 to 2007/8 by a –3. This says last year’s entry into the playoffs was a somewhat closer call, so requires hard work on the Devils’ part to secure a return.


The Devils’ first 10 games of the season are played 10 OCTOBER – 1 NOVEMBER. Our thorough analysis indicates that in that time frame, New Jersey earns an average PQC rating of only 4.7. While this is below the Curve overall, it is skewed a bit by last season’s slow start. They have won two-of-three home openers and are one-for-three in road openers over the last three seasons.

Some additional, critical statistics to keep in mind for the month of OCTOBER are:
  • Fridays and Saturdays the Devils win a combined average of 60.8% on those days.
  • And the Devils play an average of 1.67 ‘Bonus Hockey’ games (overtime or shootouts) in OCTOBER, producing an average winning percentage of 65.1%. Due to their tight checking, 65.1% of those games move into Shootouts where they win 65.9% of the time.
Unless the additions of Brian Rolston and Bobby Holik magically increases the Devils’ scoring output, expect this team to continue to rely on tight checking, defensive games where, more often than not, they prevail based on the strong play of Martin Brodeur. New Jersey as an organization will have to come to grips with determining how to properly weigh giving their last line of defense the starts necessary to get the distraction of ‘The Record’ for wins out of the way with a mix of how to ensure Brodeur is adequately rested to remain on top of his game on into a fourth, straight playoff season.

During this stretch of play, OGA will remain vigilant as we review team play and forward your New Jersey DevilsGame 10 Report to season subscribers by 2pm CST on 2 NOVEMBER and make it available for order from the On Goal Analysis web site by 2pm CST on 3 NOVEMBER. (See a sample G10R here…)

When will New Jersey progress to the 2008/9 playoffs as in the previous three seasons? Christmas? New Years? It has been before the half-way mark in each of the last two seasons, and this is a key indicator that the team is on the right glide path to the playoffs. Looking ahead into NOVEMBER, it is very important to note that there is potential for a slower Devils’ start. This may or may not be the case this season, but Devils fans will have OGA right there with them to manage their expectations and make the call.

More to follow. Until tomorrow and the Ottawa Senators Season Preview Report (SPR), this is The Colonel signing off…

TAKE ME BACK TO OGA
1. 4.

Sunday, September 28, 2008

The PHILADELPHIA FLYERS SPR by Frozen Pill


ORIGINALLY POSTED AT
www.ongoalanalysis.com
29 September, 2008


The PHILADELPHIA FLYERS have the dubious distinction of holding the NHL record for the largest drop in season-to-season point totals. In the 2005/06 season they achieved 101 points and advanced to the playoffs. The following year, the 06-07 campaign, they suffered a season-long meltdown and finished with a league-worst 56 points. Last season, they rebounded to the surprise of the NHL and most critics with a 95-point campaign. Now that’s a comeback, kid. Like a good book, the action intensified as the end of the regular season concluded and the post-season loomed.

The FLYERS surged into the playoffs winning 7 of their final 9 games. The charge continued into the playoffs as they displaced the Capitals, who were surfing their own Potomac wave having completed an equally impressive run to end the regular season and steal Carolina Hurricane’s playoff spot. The FLYERS then beat the number 1 seed in the East (Montreal) to challenge the Penguins to six hard-fought battles before succumbing to Kid Crosby and team. The PHILADELHIA club were one of the last 4 teams standing after having finished 30th in the league the prior season. They had increased their goal scoring totals by 34 goals while goals against dropped by 70, much in large part to a rejuvenated performance from Martin Biron. Biron, having the entire season to settle into the FLYERS system, finished with a 30-20-9 record and 5 shutouts giving the loving crowds of Philly a goalie they could back with enthusiasm.

To recap the 2007/8 NHL Season:
  • The PHILADELPHIA FLYERS finished the season with the league’s second best Power Play percentage at 21.82% and with 84 goals.
  • The FLYERS suffered a terrible skid in February losing 10 games in a row (0-8-2).
  • The team had seven 20-goal scorers.
  • The FLYERS have qualified for post-season play twice out of the 3 years since the lockout.
Now both the fans and the team themselves are anxious to build upon last year’s success and look to challenge Pittsburgh again in the Atlantic division and perhaps for the last spot in the East’s open invitation to Lord Stanley’s dance. They will have to do so without some of the higher priced value-players who helped propel them deep into the playoffs last season having not been able to retain both Jason Smith and R.J. Umberger due to salary cap issues. But the FLYERS believe their rash of acquisitions last year and a healthy Simon Gagne who missed the majority of last season will provide a solid core for the team.

The FLYERS began last season’s campaign with a very strong performance when measured against the OGA-developed Playoff Qualifying Curve (PQC). At the end of the first 10-game segment, they were a +2.0 when measured against the curve. By the time they had completed the next 10 games OGA knew the PHILADELPHIA FLYERS had clinched a spot in the 07-08 playoffs on 21 NOVEMBER 2007. Now, a settled Philly team is ready to resume play in the 2008/09 NHL season and OGA will be closely monitoring their performance in the first 20 games to see if they can clinch another appearance in the playoffs before the holidays. Let’s see what key characteristics we can determine when viewing the PHILADEPHIA FLYERS performance over the last three years against the PQC.

(cont)…With the return of a healthy Simon Gagne and expected increases in production totals from the mobile core of Mike Richards, Joffrey Lupul and Jeff Carter, the FLYERS look to grow their new identity with another quick start. Last season, we saw them jump to a +2 rating above the Playoff Qualifying Curve (PQC) by the end of the first 10-game segment.

As an average the PHILADELPHIA FLYERS have finished -5.0 against the PQC but the numbers were skewered by the forgetful 2006/07 season where OGA actually called them OUT of post-season play by 28 OCTOBER 2006. The team also shows a trend of consistently playing below the PQC in February around the 60-game mark. See the chart below for the FLYERS play in relation to the curve over the past three campaigns.


This season, the PHILADELPHIA FLYERS first 10 games of the season are played 11 OCTOBER – 30 OCTOBER. Our research indicates they earn a PQC rating of 5.3 during this time frame. Since the lockout, they have lost 5 of the 6 home/away openers including all 3 on the road. In regards to each season’s opening 10-game segments, they have a winning average of 9 wins and 4 losses (69.23%) at home and a losing average of 5 wins and 12 losses (29.41%) on the road. The Wachovia Center is a tough building (read: enthusiastic fans) to step into and expect to dominate against the FLYERS team.

Some statistics of note to manage your expectations in to late October are:
  • The FLYERS play half (5) of its first 10 games at home this year. They tend to play just under average in comparison to the rest of the NHL on the PQC but even within their division.
  • PHILADELPHIA has only won one of its 3 season openers since the lockout.
  • Post lockout, the FLYERS record in the first 10-game segments is 15-13-2 with 7 of the losses and 1 shootout loss coming in their dismal 2006/07 season.
  • PHILADELPHIA has played a total of 55 games requiring either OT or a Shootout (22.36% of all regular season games). In those games the FLYERS had 21 wins and 34 (38.18% winning percentage).
OGA will be measuring the FLYERS against their PQC Rating of 5.3 (as well as with all other NHL teams) in order to provide you more in-depth analysis with the PHILADELPHIA FLYERS Game 10 Report. The G10R will be delivered to our subscription customers by 2PM Central on 31 OCTOBER and available for purchase online by 2PM Central, 1 NOVEMBER. See the OGA store for more details HERE. You can also view a sample for our G10R HERE. (Make sure to view all 3 tabs!)

The PHILADELPHIA FLYERS and their fans will be formidable foes for not only the Atlantic Division but the Conference as well. They are still a large, tough team and high-octane scorer Daniel Briere looks to thrive in this organization. He is in the prime of his career and, like Biron who had also spent time in Buffalo, has settled into the Philly system and found his place within the team. Young players like Ryan Parent and perhaps even a nightly roster spot from Claude Giroux will only further accelerate the arrival of the new era in Constitution City. Everything old is new again.

Will the FLYERS be able to recreate the success of last season? Will OGA be able to make the call of PHILADELPHIA IN the playoffs before December again this year? OGA will know and you can, too.

OGA will be measuring their team performance against the PQC online and via our Game Reports available for purchase. For your best value, see our subscription information HERE. In the meantime, stay tuned to The OGA Blog and check out the PHILADELPHIA FLYERS G10R for a thorough review of the team’s performance as measured against the PQC.

Tomorrow is Great for the unique OGA analysis of the Desert Dogs and another dose of the Frozen Pill with the PHOENIX COYOTESSPR.

TAKE ME BACK TO www.ongoalanalysis.com

1. 4.

The DETROIT RED WINGS SPR by Big Tex


ORIGINALLY POSTED AT
28 September 2008

Stanley Cup Champions. Again. For the 4th time in the last 11 seasons, the Cup made its way to Detroit. The Red Wings celebrated their victory by going out and…getting better. Will the 08-09 season end with another victory parade?
Over the past three seasons, no team has come out of the starting gate faster than Detroit. Through the first ten games, the Wings average +2.3 against the Playoff Qualifying Curve. Significantly, the Red Wings have been the first team called IN the playoffs by OGA in two of the past three seasons, clinching playoff berths before young trick-or-treaters donned their costumes.

Some statistics of note from last season:
  • Detroit was the first team in the NHL to clinch a playoff berth (per OGA), on 24 OCTOBER
  • Finished 3rd in Goals For (252) and 1st in Goals Against (179)
  • Ten players scored 10+ goals, and five scored 20+
  • Eleven players had a plus/minus greater than +10, and seven were greater than +20
The Red Wings signed free agent winger Marian Hossa in the off-season, which sent a clear message to the rest of the league: We have the Cup, and we intend to keep it. As no team has repeated as Stanley Cup Champs since the Wings themselves did it back in 97 & 98, they have their work cut out for them. To retain the Cup, Detroit must deal with a short off-season, the inevitable “Stanley Cup Hangover” through the early part of the season, and tougher competition within the Central Division – the Wings’ only weakness last year (they went 17-12-3 against divisional opponents, and 39-7-4 against the rest of the NHL). While all the above will certainly take a toll, perhaps the Red Wings’ greatest challenge in 08-09 will be…

(cont)…Motivation. After playing 104 regular season and playoff games last season, Detroit – the players, the coaching staff and team management – has to be tired. Once you’ve won the Cup, how difficult is it to motivate yourself to go out and do what it takes to win another one? And, in an age of ever-increasing (salary cap-induced) parity, how do you rise above the hungry up-and-coming clubs?


The Red Wings’ first 10 games are played 9 – 29 OCTOBER. Our exhaustive research indicates that in that time frame, Detroit earns and average PQC rating of 7.3 and about 15 points in the NHL standings. Last year saw the Wings reach +2.5 above the PQC and clinch a playoff berth by 24 OCTOBER. Detroit continued to play well above the curve until game 50, then took their collective foot off the gas and coasted (played .5 below the PQC) from games 51-70. At game 71, the Red Wings shifted into playoff mode as easily as a Mustang slips into 5th gear, going 8-3-1 down the homestretch and carrying that momentum into the playoffs.

Some statistics of note for the first month of the season:
  • Post-Lockout, the Red Wings have a combined record of 21-7-2 through the first ten games
  • They have clinched a playoff berth on 24 OCTOBER in two of the last three seasons
  • Detroit plays only one back-to-back set of games in their first ten, and the first game is at home. Over the last three seasons, the Wings are 26-26 in the second game.
OGA will be measuring the Red Wings against their average PQC rating of 7.3, as well as against other NHL teams, in order to provide you more in-depth analysis with Detroit’s Game 10 Report, due to season subscribers by 2PM CST on 30 OCTOBER, and available for order from ongoalanalysis.com by 2PM CST on 31 OCTOBER. (See a sample G10R here… )

Detroit has been the most prolific team in hockey over the past three seasons, culminating with a Stanley Cup win in 07-08. As OCTOBER nears, the rest of the NHL must come to grips with the fact that this years’ model is even better (on paper). At this time, the only question facing the Wings is whether or not they have the desire to take to the ice and claim the Cup again in 08-09…or so it would seem. Teams around the league have made improvements, as well, and they are both better rested and hungry. The challenge awaits. Will Detroit rise to the occasion? Stay tuned to The OGA Blogs for updates, and check out the Red Wings’ G10R for a comprehensive progress report. Before the rest of the NHL knows, before the Wings themselves know that they’re IN the playoffs, OGA knows…and you can, too.

Monday, tune in for the Florida Panthers SPR. Until then, Big Tex says, “Try the corny dogs.”

TAKE ME BACK TO www.ongoalanalysis.com
1. 4.

The MINNESOTA WILD SPR by The Colonel


ORIGINALLY POSTED AT
http://www.ongoalanalysis.com
on 28 September 2008

The Wild have participated in the Stanley Cup playoffs in each of the last two seasons, losing in the first round both times. In 11 playoff games, however, only two Wild losses of eight were by more than one goal. While many pundits will simply say Minnesota ”…Can’t win in the playoffs,” the issue is actually that in the past they were just missing some, relatively small piece of the puzzle to push past the first round as outcomes indicate.

Over the three years, Minnesota has been relatively easy to predict against the Playoff Qualifying Curve – the PQC. They begin the season an average of +2.5 above the PQC in their first 10 games and then fall an average of – 3.7 in the following 10 games. The Wild are a bit less predictable after Game 20, but are even with the curve at Game 50 and tend to sport another significant performance dip before ending in more of a winning fashion.

The past two years, OGA called them IN the playoffs by the end of OCTOBER. Their ability to compete at that same level given team changes in the off-season bears comparison against the PQC in the Wild’s first 10 games. What did we see last season and what is on the 2008/9 horizon?

The Wild ended the last three years with an average rating of +.667 above the PQC. They finished the 2005/6 season –5 games below the PQC, responded with a +5 the following year, and finished last year a +2. Minnesota fans are hoping this does not signal a further trend downward in wins as they are facing a tougher – if that’s possible – Western Conference this season.

Of note from the 2007/8 season the Wild:
  • Kicked butt in the first 10 games, going 7-1-2 and ending with an overall +3 against The Curve. The Wild pleased fans with a season-opening five straight wins including both their home and road openers. This strong effort satisfied the PQC and led OGA to call them as a lock for the 2008 Stanley Cup Playoffs by 25 OCTOBER
  • Were zero-for-two in ‘Bonus Hockey’ (a game progressing into Overtime or a Shootout)
  • Followed up their strong performance in Games 1 – 10 with six losses in Games 11 – 20
We view the Wild as a team whose play against the PQC requires scrutiny on into the season because they tend to start strong and follow up with a performance skid to start the season which may or may not affect their overall fate for the 2009 playoffs.

A measure of the Wild’s performance against the PQC is disaplyed in the graph below. As you can see, Minnesota started and finished the last two seasons strong. The PQC, however, shows that their winning margin decreased from 2006/7 to 2007/8 by a –3. This says last year’s entry into the playoffs was a closer call, so will require hard work on the Wild’s part to secure a return to the playoffs.


The Wild’s first 10 games of the season are played 11 OCTOBER – 1 NOVEMBER. Our comprehensive analysis indicates that in that timeframe, Minnesota earns an average PQC rating of 7.5, the highest in the NHL. They have won all home openers – a potentially nice payback for an 8-minute sellout of that game this season – and are two-for-three in road openers. They also tend to win at a 70% clip in their first 10 games with a significant percentage of those victories on home ice (15-2 / 88.2%).

Some additional, critical statistics to keep in mind for the month of OCTOBER are:
  • The Wild win 82.4% of games in the 10 – 22 OCTOBER time frame.
  • Minnesota then loses 84.6% of games in the 23 OCTOBER – 2 NOVEMBER time frame.
  • Thursdays and Saturdays are good to Minnesota – they tend to win an average of 62.6% on those days.
  • Mondays, on the other hand, produce a losing percentage of 73.33% of games.
  • And the Wild play an average of three ‘Bonus Hockey’ games in OCTOBER with only a 55.2% winning percentage.
During this stretch of play, OGA will carefully review Minnesota’s performance and prepare and forward your Minnesota Wild’s Game 10 Report to season subscribers by 2pm CST on 2 NOVEMBER. It will be available to order from the On Goal Analysis web site by 2pm CST on 3 NOVEMBER. (See a sample G10R here…)

Is Minnesota going to progress to the 2008/9 playoffs like the previous two seasons, or will they be pushed out by other, surging Western Conference teams? Looking ahead into NOVEMBER, it is very important to note the potential skid the Wild have displayed over the last two seasons. If this occurs again, is not too steep a dip below the PQC, AND was preceded by a strong OCTOBER, Wild fans may not have anything worse to face than temporary frustrations in the win column. OGA will be there to make the call, and you can be, too.

More to follow. Until tomorrow and the New Jersey Devils Season Preview Report (SPR), this is The Colonel signing off…

TAKE ME BACK TO OGA
1. 4.

The NEW YORK ISLANDERS SPR by Frozen Pill


ORIGINALLY POSTED AT
www.ongoalanalysis.com
28 September 2008


Is this a rebuilding year for the NEW YORK ISLANDERS or are they still shopping for a blueprint for reconstruction? The ISLES and their fans were excited at the beginning of 2007/8 season, hoping to build on recent improvement. Goalie Rick DiPietro had previously signed a record-setting (at the time) contract in terms (15 years) and fans were desperate to talk about a surging team. The 07-08 season, ended however, with a team just simply beaten by the injury bug as judiciously as by their opponents.

Dipietro is a very talented goalie and sees plenty of action. At the start of last season he opened play with a 10-5-0 record but would later struggle and eventually give in to injury after the All-Star game. When the ISLES were mathematically eliminated from post-season play, they called up rookie Kyle Okposo (7th overall pick in the 2006 draft) who proceeded to enthuse hopes with 5 points in the remaining 9 games.

In the 2007/8 NHL Season:
  • The NEW YORK ISLANDERS missed a total count of 414 man games to injury.
  • The ISLES’ production would go down by nearly 50 goals from the previous season.
  • At the conclusion of the 07-08 season, they were last in the league in offense (2.30 GPG) and second to last in Power Play ranking 29th at 14.55%.
  • The ISLANDERS did not qualify for post-season play for the second time since the NHL lockout.
To all things, there is a season. Fans on the Long Island are hoping the start of the 2008/9 season shows a team turned from last season. If DiPietro and the team can stay healthy and off-season acquisitions Mark Streit and veteran Doug Weight provide expected offensive contributions the team so desperately needs, perhaps fans will say the rebuilding process is under way. Remember, the ISLES play against a solid and very local Atlantic Division whose neighborly qualities are not accommodating. The ISLANDERS, like so many other New Yorkers, will need to work very hard indeed to secure any bit of real estate in the neighborhood.

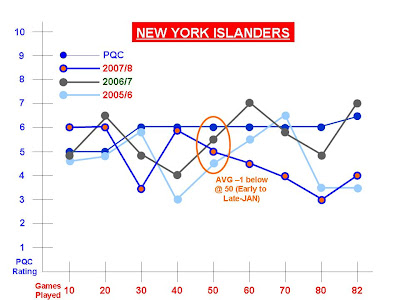
Many times rebuilding a team is known as a youth movement. Sometimes, you simply don’t have a choice but to dip into the prospect pool before it’s considered optimal and allow young players to contribute and begin creating an NHL identity. A long off-season has helped heal an injured team but will the bleeding stop? They finished last season a gruesome -7 against the OGA-developed Playoff Qualifying Curve (PQC) after having finished +2 by Game 20. Let’s see what the PQC has to say about our expectations for the 2008/9 NHL season.


(cont)…The struggling NEW YORK ISLANDERS lost both Miroslav Satan and Ruslan Fedotenko to free agency during the summer. They hope the new addition of Doug Weight will bring both some points and veteran leadership to help right the barge. Their popular coach Ted Nolan was relieved during the off-season having had differences with GM Garth Snow on growth strategies. So now is the time to implement a plan forward, play the young talent and begin the necessary growing pains. Opportunities are abundant on the Island and we will see plenty of Kyle Okposo as well as some of the other young talent brought up last year including Blake Comeau and Frans Nielsen.

Last season’s injury bug and uninspired offense were not in play during the first 10 games of the 07-08 season. The ISLANDERS, in fact, had begun the season winning 11 of their first 17 games. The Playoff Qualifying Curve (PQC) shows they played +1 against the PQC for the first twenty games last season.


This season, the NEW YORK ISLANDERS first 10 games of the season are played 10 OCTOBER – 1 NOVEMBER. Our research indicates they earn a PQC rating of 5.33 during this time frame. On average, they will play strong hockey and then begin a downward slump where they exist below the curve for the majority of the remainder of the season.

Some statistics of note to manage your expectations in to late October are:
  • The ISLANDERS play 6 of its first 10 games at home this year. They will play just under average in comparison to the rest of the NHL on the PQC.
  • Post lockout, they are a combined middle-of-the pack performer in their first 10 games. (14-14-2).
  • The ISLANDERS have lost two of the last three season-openers.
OGA will be measuring the ISLANDERS against their PQC Rating of 5.33 (as well as with all other NHL teams) in order to provide you more in-depth analysis with the ISLANDERS Game 10 Report. The G10R will be delivered to our subscription customers by 2PM Central on 2 NOVEMBER and available for purchase online by 2PM Central, 3 NOVEMBER. See the OGA store for more details HERE. You can also view a sample for our G10R HERE. (Make sure to view all 3 tabs!)

The ISLES will need to bring a new round of enthusiasm to start the 08-09 NHL season and try to erase lingering effects from last season’s debacle. They have the newly acquired defenseman Mark Streit to help bring some offensive punch, even if from the back of the class. They have a well-rested, post-operative elite goalie who needs to play in order for this team to build confidence. And they now have a new coach, making his NHL debut in Scott Gordon, the AHL coach of the year. So call it a youth movement or rebuilding or whatever it has to be. But the ISLES are ready to let the past be behind them and to start anew…again.

Ah yes, another season turned. Fall is in the air but it feels like spring on Long Island. Will the young guns show up early in the year to make an impact? Will they be able to gain momentum throughout the season and perhaps push for the final playoff spot in the East? OGA will be tracking the growth and measuring their team performance against the PQC.

Stay tuned to the OGA Blog and check out the NEW YORK ISLANDERS G10R for a thorough review of the team’s performance as measured against the PQC.

Tomorrow, you can start the week with another dose of the Frozen Pill and the PHILADELPHIA FLYERSSPR.

TAKE ME BACK TO ongoalanalysis.com